This article shares how to use Gcov and LCOV to metrics code coverage for C/C++ projects. If you want to know how Gcov works, or you need to metrics code coverage for C/C++ projects later, I hope this article is useful to you.
Problems
The problem I’m having: A C/C++ project from decades ago has no unit tests, only regression tests, but you want to know what code is tested by regression tests? Which code is untested? What is the code coverage? Where do I need to improve automated test cases in the future?
Can code coverage be measured without unit tests? Yes.
Code coverage tools for C/C++
There are some tools on the market that can measure the code coverage of black-box testing, such as Squish Coco, Bullseye, etc. Their principle is to insert instrumentation when build product.
I’ve done some research on Squish Coco, because of some unresolved compilation issues that I didn’t buy a license for this expensive tool.
When I investigated code coverage again, I found out that GCC has a built-in code coverage tool called Gcov.
Prerequisites
For those who want to use Gcov, to illustrate how it works, I have prepared a sample program that requires GCC and LCOV to be installed before running the program.
If you don’t have an environment or don’t want to install it, you can check out this example repository
Note: The source code is under the master branch master, and code coverage result html under branch coverage.
# This is the version of GCC and lcov on my test environment. sh-4.2$ gcc --version gcc (GCC) 4.8.5 20150623 (Red Hat 4.8.5-39) Copyright (C) 2015 Free Software Foundation, Inc. This is free software; see the sourcefor copying conditions. There is NO warranty; not even for MERCHANTABILITY or FITNESS FOR A PARTICULAR PURPOSE.
sh-4.2$ lcov -v lcov: LCOV version 1.14
How Gcov works
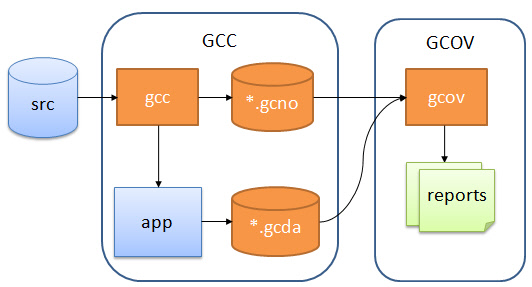
Gcov workflow diagram
There are three main steps:
Adding special compilation options to the GCC compilation to generate the executable, and *.gcno.
Running (testing) the generated executable, which generates the *.gcda data file.
With *.gcno and *.gcda, generate the gcov file from the source code, and finally generate the code coverage report.
Here’s how each of these steps is done exactly.
1. Compile
The first step is to compile. The parameters and files used for compilation are already written in the makefile.
As you can see from the output, this program is compiled with two compile options -fprofile-arcs and -ftest-coverage. After successful compilation, not only the main and .o files are generated, but also two .gcno files are generated.
The .gcno record file is generated after adding the GCC compile option -ftest-coverage, which contains information for reconstructing the base block map and assigning source line numbers to blocks during the compilation process.
2. Running the executable
After compilation, the executable main is generated, which is run (tested) as follows
./main
Click to see the output when running main
sh-4.2$ ./main
Start calling foo() ...
when num is equal to 1...
when num is equal to 2...
When main is run, the results are recorded in the .gcda data file, and if you look in the current directory, you can see that two .gcda files have been generated.
$ ls
foo.c  foo.gcda  foo.gcno  foo.h  foo.o  img  main  main.c  main.gcda  main.gcno  main.o  makefile  README.md
.gcda record data files are generated because the program is compiled with the -fprofile-arcs option introduced. It contains arc transition counts, value distribution counts, and some summary information.
3. Generating reports
make report
Click to see the output of the generated report
sh-4.2$ make report gcov main.c foo.c File 'main.c' Lines executed:100.00% of 5 Creating 'main.c.gcov'
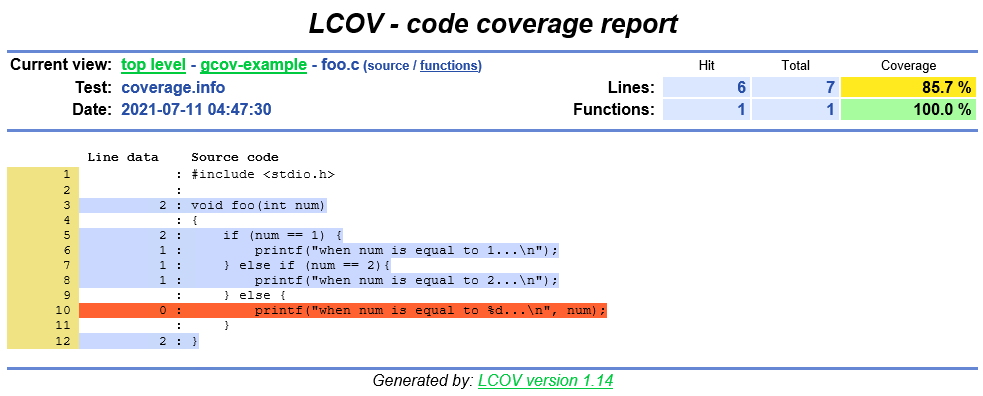
File 'foo.c' Lines executed:85.71% of 7 Creating 'foo.c.gcov'
Lines executed:91.67% of 12 lcov --capture --directory . --output-file coverage.info Capturing coverage data from . Found gcov version: 4.8.5 Scanning . for .gcda files ... Found 2 data files in . Processing foo.gcda geninfo: WARNING: cannot find an entry for main.c.gcov in .gcno file, skipping file! Processing main.gcda Finished .info-file creation genhtml coverage.info --output-directory out Reading data file coverage.info Found 2 entries. Found common filename prefix "/workspace/coco" Writing .css and .png files. Generating output. Processing file gcov-example/main.c Processing file gcov-example/foo.c Writing directory view page. Overall coverage rate: lines......: 91.7% (11 of 12 lines) functions..: 100.0% (2 of 2 functions)
Executing make report to generate an HTML report actually performs two main steps behind this command.
With the .gcno and .gcda files generated at compile and run time, execute the command gcov main.c foo.c to generate the .gcov code coverage file.
With the code coverage .gcov file, generate a visual code coverage report via LCOV.
The steps to generate the HTML result report are as follows.
# 1. Generate the coverage.info data file
lcov --capture --directory . --output-file coverage.info
# 2. Generate a report from this data file
genhtml coverage.info --output-directory out
Delete all generated files
All the generated files can be removed by executing make clean command.
Click to see the output of the make clean command
sh-4.2$ make clean
rm -rf main *.o *.so *.gcno *.gcda *.gcov coverage.info out
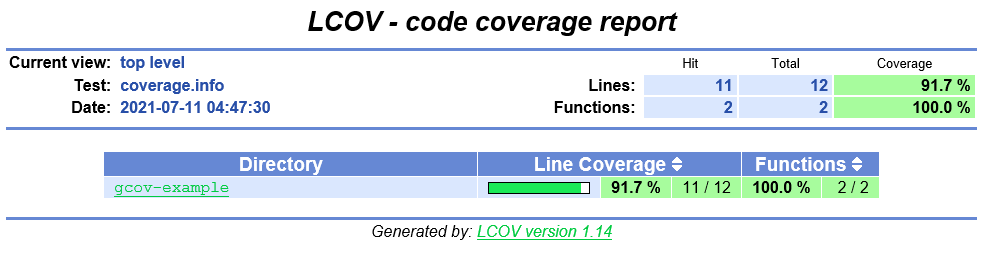
Code coverage report
The home page is displayed in a directory structure
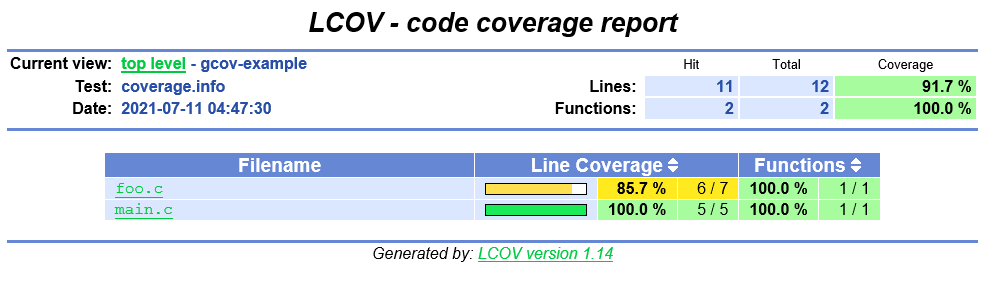
After entering the directory, the source files in that directory are displayed
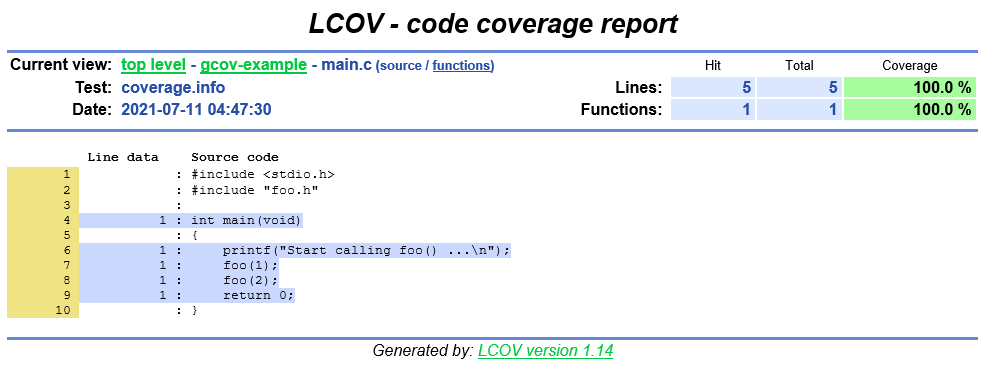
The blue color indicates that these statements are overwritten
Red indicates statements that are not overridden
LCOV supports statement, function, and branch coverage metrics.
Side notes:
There is another tool for generating HTML reports called gcovr, developed in Python, whose reports are displayed slightly differently from LCOV. For example, LCOV displays it in a directory structure, while gcovr displays it in a file path, which is always the same as the code structure, so I prefer to use the former.
I’ve run into some situations when the build fails, perhaps because some processes don’t finish, and even setting a timeout doesn’t make the Jenkins job fail.
So, to fix this problem, I used try .. catch and error to make my Jenkins job failed, hopes this also helps you.
Dependent module /usr/lib/libldap.a(libldap-2.4.so.2) could not be loaded.
通过 SSH 进行 git clone 出现 Authentication failed
问题1:Dependent module /usr/lib/libldap.a(libldap-2.4.so.2) could not be loaded
Jenkins 通过 HTTPS 来 checkout 代码的时候,出现了如下错误:
[2021-06-20T14:50:25.166Z] ERROR: Error cloning remote repo 'origin'
[2021-06-20T14:50:25.166Z] hudson.plugins.git.GitException: Command "git fetch --tags --force --progress --depth=1 -- https://git.company.com/scm/vas/db.git +refs/heads/*:refs/remotes/origin/*" returned status code 128:
[2021-06-20T14:50:25.166Z] stdout:
[2021-06-20T14:50:25.166Z] stderr: exec(): 0509-036 Cannot load program /opt/freeware/libexec64/git-core/git-remote-https because of the following errors:
[2021-06-20T14:50:25.166Z] 	0509-150   Dependent module /usr/lib/libldap.a(libldap-2.4.so.2) could not be loaded.
[2021-06-20T14:50:25.166Z] 	0509-153   File /usr/lib/libldap.a is not an archive or
[2021-06-20T14:50:25.166Z] 		   the file could not be read properly.
[2021-06-20T14:50:25.166Z] 	0509-026 System error: Cannot run a file that does not have a valid format.
[2021-06-20T14:50:25.166Z]
[2021-06-20T14:50:25.166Z] 	at org.jenkinsci.plugins.gitclient.CliGitAPIImpl.launchCommandIn(CliGitAPIImpl.java:2450)
[2021-06-20T14:50:25.166Z] 	at org.jenkinsci.plugins.gitclient.CliGitAPIImpl.launchCommandWithCredentials(CliGitAPIImpl.java:2051)
[2021-06-20T14:50:25.166Z] 	at org.jenkinsci.plugins.gitclient.CliGitAPIImpl.access$500(CliGitAPIImpl.java:84)
[2021-06-20T14:50:25.167Z] 	at org.jenkinsci.plugins.gitclient.CliGitAPIImpl$1.execute(CliGitAPIImpl.java:573)
[2021-06-20T14:50:25.167Z] 	at org.jenkinsci.plugins.gitclient.CliGitAPIImpl$2.execute(CliGitAPIImpl.java:802)
[2021-06-20T14:50:25.167Z] 	at org.jenkinsci.plugins.gitclient.RemoteGitImpl$CommandInvocationHandler$GitCommandMasterToSlaveCallable.call(RemoteGitImpl.java:161)
[2021-06-20T14:50:25.167Z] 	at org.jenkinsci.plugins.gitclient.RemoteGitImpl$CommandInvocationHandler$GitCommandMasterToSlaveCallable.call(RemoteGitImpl.java:154)
..........................
[2021-06-20T14:50:25.167Z] 	Suppressed: hudson.remoting.Channel$CallSiteStackTrace: Remote call to aix-devasbld-01
[2021-06-20T14:50:25.167Z] 		at hudson.remoting.Channel.attachCallSiteStackTrace(Channel.java:1800)
..........................
[2021-06-20T14:50:25.168Z] 		at java.lang.Thread.run(Thread.java:748)
[2021-06-20T15:21:20.525Z] Cloning repository https://git.company.com/scm/vas/db.git
# AIX 7.1-TL4-SP1 bash-4.3$ oslevel -s 7100-04-01-1543 bash-4.3$ ssh -vvv git.company.com OpenSSH_6.0p1, OpenSSL 1.0.1e 11 Feb 2013 debug1: Reading configuration data /etc/ssh/ssh_config debug1: Failed dlopen: /usr/krb5/lib/libkrb5.a(libkrb5.a.so): 0509-022 Cannot load module /usr/krb5/lib/libkrb5.a(libkrb5.a.so). 0509-026 System error: A file or directory in the path name does not exist.
# New machine AIX 7.1-TL5-SP6 $ oslevel -s 7100-05-06-2015 $ ssh -vvv git.company.com OpenSSH_7.5p1, OpenSSL 1.0.2t 10 Sep 2019 debug1: Reading configuration data /etc/ssh/ssh_config debug1: Failed dlopen: /usr/krb5/lib/libkrb5.a(libkrb5.a.so): 0509-022 Cannot load module /usr/krb5/lib/libkrb5.a(libkrb5.a.so). 0509-026 System error: A file or directory in the path name does not exist.
# Linux 上不识别改选项
stderr: /home/****/.ssh/config: line 1: Bad configuration option: allowpkcs12keystoreautoopen
/home/****/.ssh/config: terminating, 1 bad configuration options
fatal: Could not read from remote repository.
Host *
  AllowPKCS12keystoreAutoOpen no
#   ForwardAgent no
#   ForwardX11 no
#   RhostsRSAAuthentication no
#   RSAAuthentication yes
#   PasswordAuthentication yes
#   HostbasedAuthentication no
#   GSSAPIAuthentication no
#   GSSAPIDelegateCredentials no
#   GSSAPIKeyExchange no
#   GSSAPITrustDNS no
#   ....省略
fatal: write error: A file cannot be larger than the value set by ulimit.
$ git clone -b dev https://<username>:<password>@git.company.com/scm/vmcc/opensrc.git --depth 1
Cloning into 'opensrc'...
remote: Counting objects: 2390, done.
remote: Compressing objects: 100% (1546/1546), done.
fatal: write error: A file cannot be larger than the value set by ulimit.
fatal: index-pack failed
I’m just documenting to myself that it was solved by following.
When I want to integrate the ESlint report with Jenkins. I encourage a problem
That is eslint-report.html display different with it on my local machine, and I also log to Jenkins server and grab the eslint-report.html to local, it works well.
I used HTML Publisher plugin to display the HTML report, but only the ESlint HTML report has problems other report work well, so I guess this problem may be caused by Jenkins.
To better manage the branches on Git(I sued Bitbucket), integration with CI tool, Artifactory, and automation will be more simple and clear.
For example, good unified partition naming can help the team easily find and integrate without special processing. Therefore, you should unify the partition naming rules for all repositories.
Branches naming convention
main branch naming
In general, the main’s branch names most like master or main.
Development branch naming
I would name my development branch just called develop.
Bugfix and feature branches naming
For Bitbucket, it has default types of branches for use, like bugfix/, feature/. So my bugfix, feature combine with the Jira key together, such as bugfix/ABC-1234 or feature/ABC-2345.
Hotfix and release branches naming
For hotfix and release, my naming convention always like release/1.1.0, hotfix/1.1.0.HF1.
Other branches
Maybe your Jira task ticket you don’t want to make it in bugfix or feature, you can name it to start with task, so the branch name is task/ABC-3456.
If you have to provide diagnostic build to custom, you can name your branch diag/ABC-5678.
Summary
Anyway, having a unified branch naming convention is very important for implement CI/CD and your whole team.
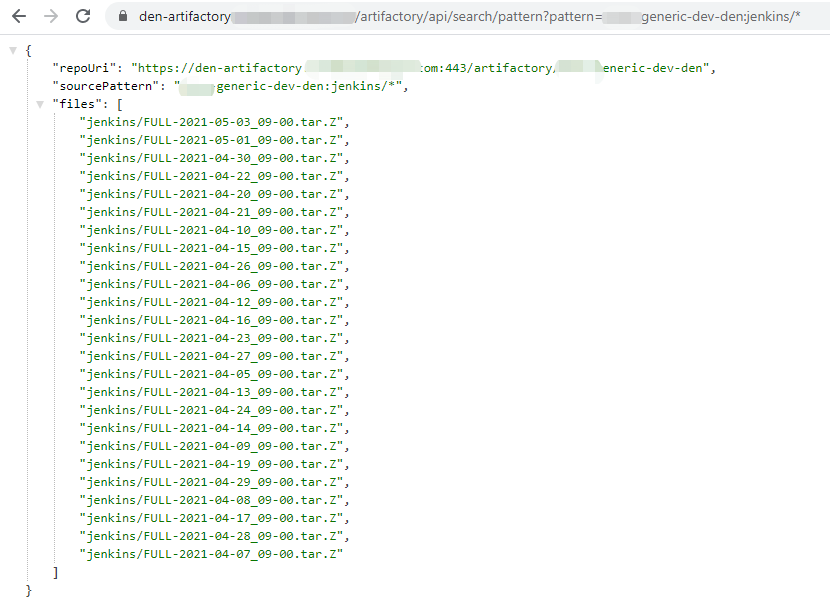
When you do CI with JFrog Artifactory when you want to download the entire folder artifacts, but maybe your IT doesn’t enable this function, whatever some seasons.
You can try the below JFrog Artifactory API to know if you’re using Artifactory whether allowed to download the entire folder artifacts.
just visit this API URL: https://den-artifactory.company.com/artifactory/api/archive/download/team-generic-release-den/project/abc/main/?archiveType=zip
You will see an error message returned if the Artifactory is not allowed to download the entire folder.
# which day ago do you want to download N_DAY_AGO=$4 # today START_TIME=$(($(date --date="$N_DAY_AGO days ago" +%s%N)/1000000)) END_TIME=$(($(date +%s%N)/1000000))
if [ ! -x "`which sha1sum`" ]; thenecho"You need to have the 'sha1sum' command in your path."; exit 1; fi
RESULTS=`curl -s -X GET -u $USERNAME:$PASSWORD"$ARTIFACTORY/api/search/creation?from=$START_TIME&to=$END_TIME&repos=$REPO" | grep uri | awk '{print $3}' | sed s'/.$//' | sed s'/.$//' | sed -r 's/^.{1}//'` echo$RESULTS
for RESULT in$RESULTS ; do echo"fetching path from $RESULT" PATH_TO_FILE=`curl -s -X GET -u $USERNAME:$PASSWORD$RESULT | grep downloadUri | awk '{print $3}' | sed s'/.$//' | sed s'/.$//' | sed -r 's/^.{1}//'`
Then you can use Shell, Python language to get the file path from the response, then use curl -u $USERNAME:$PASSWORD -O $PATH_TO_FILE command to download the file one by one.
If you have better solutions, suggestions, or questions, you can leave a comment.